INP: good threshold (200 ms) and fixes
Interaction to Next Paint explained: the 200 ms and 500 ms thresholds, the three phases of a slow interaction, and the fixes that web.dev recommends.
· Updated · 4 min read
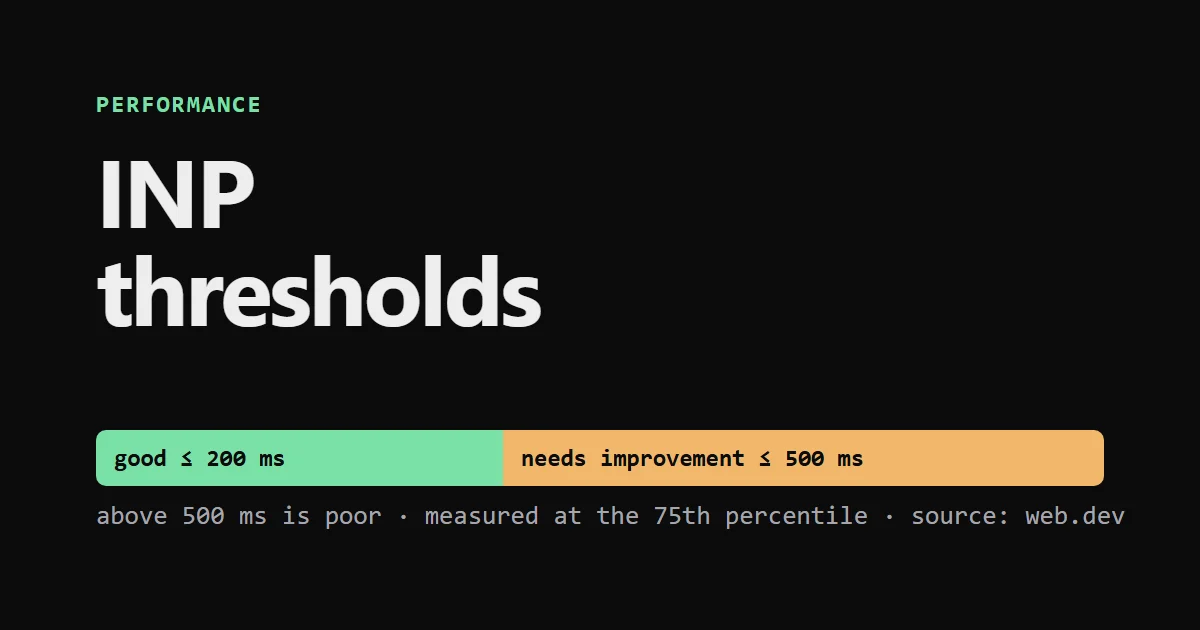
Interaction to Next Paint (INP) measures how long a page takes to respond to clicks, taps and key presses. A page is good at 200 milliseconds or less, needs improvement up to 500 ms and is poor above that, measured at the 75th percentile of real visits. To fix a bad INP, find the slow interaction and break its work into smaller tasks.
This is a guide built from web.dev's INP documentation. I have not measured INP in field data on my own site, so the examples from my pages are about what I changed, not about results.
What INP counts#
INP looks at mouse clicks, touchscreen taps and key presses. Scrolling, hovering and zooming are not counted. For every interaction it measures the time from the input to the next frame being shown, and the final value is the longest interaction of the visit, ignoring outliers. On pages with more than 50 interactions, it ignores one highest interaction for every 50.
web.dev calls INP the successor of First Input Delay (FID). FID only measured the delay before the first interaction was handled. INP covers all of them and includes the time until the screen updates.
| Rating | INP at the 75th percentile |
|---|---|
| Good | 200 ms or less |
| Needs improvement | over 200 ms, up to 500 ms |
| Poor | over 500 ms |
The thresholds are measured separately for mobile and desktop visits.
The three parts of a slow interaction#
An interaction has three phases, and each one has a different cause:
- Input delay: the time before any callback for the interaction runs. The main thread is busy with something else, such as a script, a timer or a previous interaction.
- Processing duration: the time all the callbacks take to run. This is your event handler code.
- Presentation delay: the time from the end of the callbacks until the next frame is presented. Layout, style and paint work lives here.
Knowing which phase is large tells you where to look. A long input delay points to something running on load or in the background. A long processing duration points at your own handler. A long presentation delay points at the size of the page and the amount of rendering work.
Fixes from web.dev#
The Optimize INP guide lists these techniques:
- Yield to the main thread. Break the work in an event callback into separate tasks. The guide notes that
setTimeoutis one way to do it, because its callback runs in a new task, and says that yielding indiscriminately is better than not yielding at all. - Run only what the next frame needs first. Update the interface, then defer the rest. The pattern is to apply the visual change in the handler, schedule the rest with
requestAnimationFrameand callsetTimeoutinside it so the non-critical work runs in a new task. - Avoid long tasks. Long tasks block the main thread, and script evaluation during page load can create them.
- Reduce input delay. It can come from scripts, fetches, timers or overlapping interactions.
- Avoid layout thrashing. Reading styles right after changing them forces layout to run synchronously.
- Keep the DOM small. When the DOM is small, rendering work usually finishes quickly.
- Use
content-visibility. It amounts to lazily rendering elements as they approach the viewport. - Limit client-side HTML rendering. The browser will not yield until it has finished parsing and rendering a big block of HTML that scripts produce.
The guide also reminds you that each browsing context has its own main thread, and the page's INP includes slow interactions inside iframes.
A sketch of yielding#
This is the idea from the guide, in code:
button.addEventListener("click", () => {
  // The part the user must see in the next frame.
  panel.classList.add("is-open");

  // Everything else runs after that frame, in its own task.
  requestAnimationFrame(() => {
    setTimeout(() => {
      sendAnalytics();
      warmCaches();
    }, 0);
  });
});
The first update is cheap, so the frame can be presented at once. The slow work no longer sits in the same task as the click.
Why a Lighthouse report shows no INP#
Web.dev says INP can be measured in the field and in the lab, and that some lab tools will not report it. A standard Lighthouse report loads the page and does not interact with it, so it gives Total Blocking Time (TBT) instead. TBT is a useful hint about long tasks, but it is not the same measure. Lab tools can measure INP only for the interactions you perform, so field data, for example from the Chrome UX Report, stays the reference.
Third-party scripts and the first interaction#
Third-party scripts are a common source of long tasks. On this site, Hotjar and Google Tag Manager load on the first scroll, key press, click or touch, or after seven seconds, after the load event, so that they stay off the critical path of the first paint. That is meant to keep them away from the largest paint. It may also move the cost of evaluating those scripts into the first interaction, which is exactly where INP looks. I have not measured whether it does. If INP matters for your site, test the load timing of third-party tags with real interactions, not only with a lab run.
Limits of this guide#
The thresholds and techniques come from web.dev, which I read on 18 October 2026, and the page says it was last updated in September 2025. The setTimeout pattern is the one that the guide describes. Newer scheduling APIs exist, but I did not check them for this post.