Three.js WebGPUTSLWeb WorkerOctree LODTypeScriptVitest
Керування
- Drag to orbit, right-drag to pan, Ctrl or ⌘ with the wheel zooms towards the cursor; on touch, two fingers orbit and pinch to zoom, one finger scrolls the page
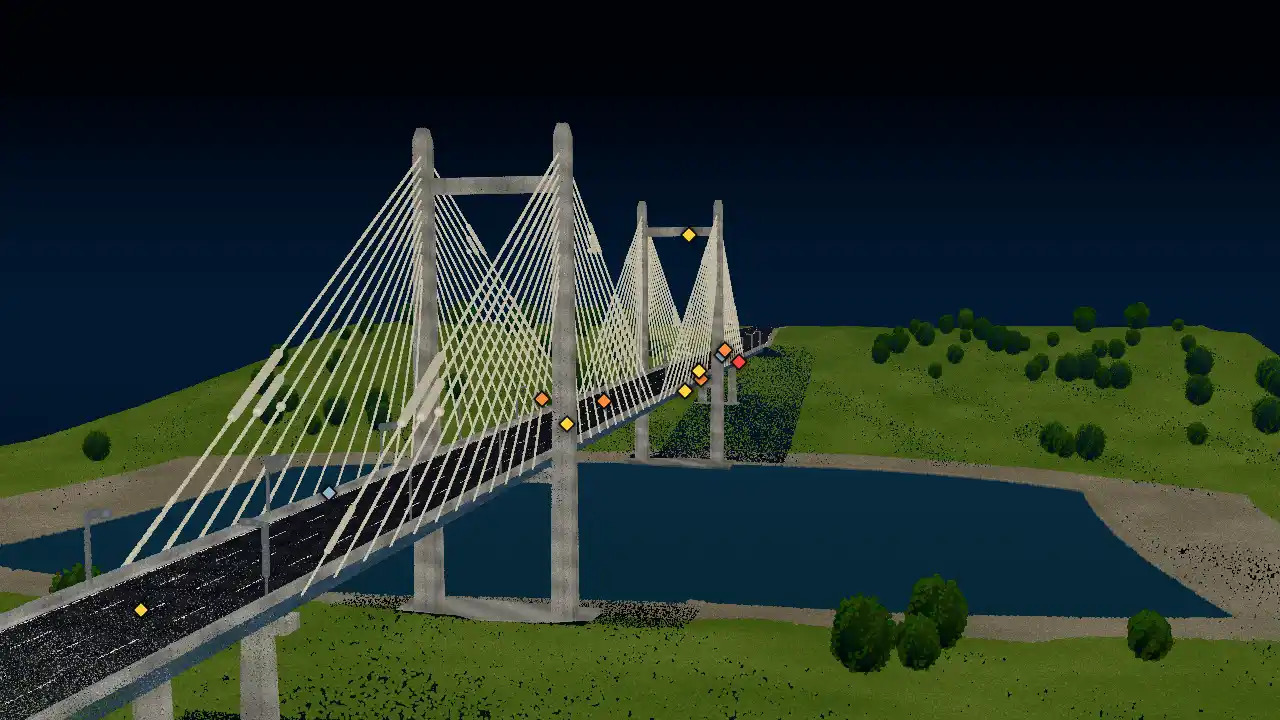
- View: Points, Mesh (the design model) or Blend; Colour by RGB, intensity, elevation or deviation from design
- Click a finding in the list or its diamond on the structure to fly there and open its card; N and P step through findings, Escape closes the card
- Measure: pick two points on the scan for distance, height difference, horizontal distance and slope, with both points in projected coordinates
- Section: slide a cutting plane along the bridge by chainage; [ and ] move it by 10 m
- Keyboard: focus the viewer, arrow keys orbit, + and - zoom, 1 to 3 change the view, 4 to 7 the colouring, M measure, S section, Home resets
- Add ?quality=low for the light tier, ?webgl to force the WebGL 2 backend, ?debug for timings and float precision figures
Uses WebGPU where the browser has it (current Chrome and Edge on desktop and Android, Safari 26) and falls back to WebGL 2 elsewhere; the panel says which one runs. Phones and small CPUs get about 1 million points. Without WebGL the poster and the inspection log stay. Respects the reduced-motion setting: no camera flights (a short fade cuts to the finding), no damping and instant view changes.
Питання
What is WebGPU and what happens without it?
WebGPU is the newer browser graphics API that follows Vulkan, Metal and Direct3D 12. Three.js's WebGPURenderer uses it when available and otherwise falls back to a WebGL 2 backend with the same scene and node materials; the viewer's panel shows which backend is active.
How can a browser draw millions of points smoothly?
The points are organised in an octree where every node holds a random subsample of its cell. Each frame the viewer walks the tree from the root by screen-space error, the projected spacing of a node's points in pixels, and draws nodes until a point budget is reached, so near parts get detail and far parts stay coarse.
How do you avoid jitter with large projected coordinates?
Easting and northing in the millions need about 0.5 m steps in 32-bit floats. The scene is kept in metres relative to a local origin, so GPU positions stay within a few hundred metres (sub-millimetre float precision), and the projected coordinates are added back in 64-bit JavaScript numbers only for display and measurement.
Where does the scan data come from?
It is synthetic. A Web Worker samples the surfaces of a code-generated design model and terrain, adds range noise, intensity and colour, bakes in a main-span sag, a pier settlement, a pylon lean and the 13 findings, and drops returns from the water, as a real laser scan would. The bridge, site and findings are fictional.
How is the deviation heat map computed?
Each scanned point stores its signed distance from the design surface along the surface normal, in millimetres. The colour ramp runs from minus 30 mm (blue) through 0 (green) to plus 30 mm (red); the terrain is not compared and stays grey.
Як це зроблено
Spanlens is a concept inspection viewer for large structures: a synthetic laser scan of a 640 m cable-stayed bridge, rendered and inspected in the browser. The bridge, site, survey and findings are fictional.
- Renderer. Three.js r187
WebGPURenderer from three/webgpu, with materials written in TSL (Three's node shading language). When the browser has no WebGPU adapter, the same renderer switches to its WebGL 2 backend; the panel reads the active backend from renderer.backend. ?webgl forces the fallback for comparison. It loads through the experiment's own dynamic chunk under Next 16 with Turbopack without any special configuration; three/tsl and OrbitControls share the same three.core.js module, so there is one copy of the core. - Design model in code. The bridge is built from about 1,100 parametric parts (swept deck sections that follow a crest vertical curve, tapered pylon legs and pier columns, boxes, 8-sided cable prisms), each with an element ID such as
GR-S-S3 or ST-PY1-NM-09. The same triangles feed the mesh view and the scan sampler. Terrain is a noise-shaped river valley with road embankments behind the abutments; piers and pylons stand on footings set into it. - Synthetic scan. A module Web Worker samples every visible triangle by area (undersides less dense, cables and rails more), skips faces hidden inside the model or below ground, and adds 4 mm range noise along the normal, intensity from material reflectance and incidence angle, and true colour with weathering, lane markings and the findings' marks. The terrain is sampled like an airborne strip with slight flight-line banding, trees are noisy volumetric crowns, and the water returns nothing. Denser close-range patches sit at the findings, as a second inspection pass would give. About 4.8 million points on the high tier take roughly 3 s to generate and 1.5 s to index on a desktop CPU; the low tier is about 1 million points.
- As-built deformations and deviation. A 42 mm main-span sag with a small twist, 26 mm settlement over pier P2, a 34 mm lean of the west pylon, cable sag and two displaced bearings are applied to the sampled design points. Each point stores its signed distance from the design surface along the normal (displacement projected on the normal plus noise and local material loss), which is the deviation heat map. Terrain is marked "not assessed".
- Octree LOD. The worker shuffles the points once, then builds an octree where each node keeps the first 20,000 points of its cell (a uniform random subsample) and passes the rest to its eight children, using an index array and a counting sort, no per-point objects. Bounds are merged bottom-up. About 530 nodes, depth 7.
- Selection and streaming. Each frame, a best-first walk from the root ordered by screen-space error (node point spacing projected to pixels) picks nodes in the frustum and in front of the section plane until the point budget (3.2 M high, 0.9 M low) is used. Missing nodes are requested from the worker in that priority order, eight at a time; payloads arrive as transferred typed arrays (x, y, z, deviation as float32 plus RGBA-intensity as unorm8, 20 bytes a point) and become GPU buffers at up to 600,000 points a frame. The worker drops its copy once everything is on the main thread.
- Point rendering. WebGPU only draws 1-pixel point primitives, so each node is an instanced billboard quad:
PointsNodeMaterial on a mesh with an InstancedBufferGeometry, the position taken from the instance attribute and the size computed in TSL from the node's spacing (a per-object uniform), the projection scale and the view depth, clamped to a pixel range. Round splats come from an alpha test on the quad's UV. One material serves every node; colour modes, section plane, focus ring and the view-mode fade are uniforms. - Large coordinates. Everything on the GPU is in metres relative to a local origin, so positions stay within about ±460 m where float32 resolves well under a millimetre. The projected coordinates (UTM-style easting and northing in the hundreds of thousands and millions, bearing 63.5°) are added back in float64 on the CPU only for the cursor read-out, the measurement and the finding cards.
?debug shows the float32 step at the northing (0.5 m) next to the step in the local frame. - Picking and measuring. Picks are done on the CPU against the loaded, visible nodes: a ray from the camera, a slab test on each node's bounds, then the nearest point within a cone of a few pixels. Hover picks use only the coarse levels and run at most every 90 ms.
- Section plane. Points beyond the plane are discarded in the shader; the meshes are clipped with a Three.js
ClippingGroup, and nodes entirely past the plane are not selected or streamed. - Interface. Cooperative gestures like the site maps: the page scrolls through the viewer, Ctrl or Cmd with the wheel zooms, one finger scrolls on touch and two fingers orbit and zoom; a short hint appears when a gesture scrolled the page instead. HTML over the canvas: markers and the measurement label are moved with transforms after each rendered frame, without React renders. Arrow keys orbit, + and - zoom, number keys switch view and colour, and the findings list and the inspection log under the viewer are plain buttons and text.
- Lifecycle. Rendering is on demand (camera moves, flights, fades, uploads) and pauses off-screen and in hidden tabs. Device or context loss shows the poster and the log. On unmount the worker is terminated and all geometries, materials and the renderer are disposed. Under reduced motion camera flights cut through a 150 ms fade, damping is off and view changes are instant.