Browser game performance that holds up
How I keep canvas and WebGL games smooth on weak phones and GPU-less machines: fps watchdogs, a light tier, no per-frame allocations, baked layers.
· 5 min read
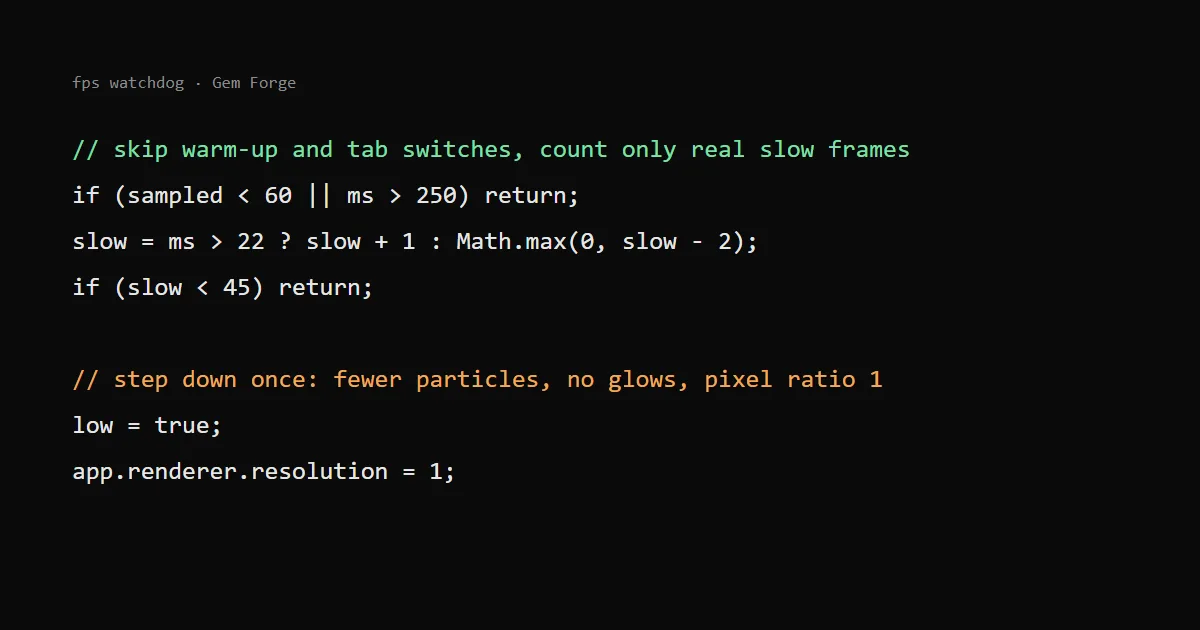
A browser game stays smooth on weak hardware when it measures its own frame time and gives up detail on its own, instead of guessing the device up front. The other half is boring: stop allocating inside the frame, draw expensive things once, and keep every canvas on the same rendering path.
Everything below comes from three games in my Lab: Gem Forge (a PixiJS match-3), Greek Sail (a WebGL sailing world) and Windfall (a layered canvas landscape). The numbers are from my own test runs, not from a benchmark suite.
Don't guess the device, watch the frames#
My first instinct was the usual one: check navigator.hardwareConcurrency, screen size or the GPU name and pick a quality level at start. It fails both ways. A cheap Android phone with eight slow cores looks strong, and a good laptop on battery saver looks fine on paper and runs at 35 fps.
What works better is a watchdog in the game loop. It only looks at real frame times and steps down once the game is clearly struggling. This is the one from Gem Forge:
const SLOW_FRAME_MS = 22; // about 45 fps

private watchFrames(ms: number) {
  if (this.low || document.hidden) return;
  this.sampled++;
  // Skip the first second (shader compile, texture upload) and huge gaps (tab switch, debugger).
  if (this.sampled < 60 || ms > 250) return;
  this.slowFrames = ms > SLOW_FRAME_MS ? this.slowFrames + 1 : Math.max(0, this.slowFrames - 2);
  if (this.slowFrames < 45) return;
  this.low = true;
  this.app.renderer.resolution = 1;
  this.app.resize();
  this.onLow();
}
Three details in there matter more than they look:
- The first 60 frames are ignored. The first second of any WebGL page is slow because shaders compile and textures upload. If you count it, every device lands in the light tier.
- A fast frame takes away two slow points, a slow frame adds one. One hitch from garbage collection or a notification never triggers the switch; only a sustained problem does.
- Frames longer than 250 ms are skipped. Those come from a hidden tab or a breakpoint, not from the game being heavy.
Greek Sail does the same with a time window: under 45 fps for about three seconds steps detail down to 0.75, and if that is still not enough, to a still scene. It never steps back up. I tried stepping up again once things were fine and got a game that pulsed between sharp and blurry every few seconds, which looks worse than staying blurry.
One more rule from Greek Sail: the step-down waits for a quiet moment. Changing the canvas size reallocates the drawing buffer, and doing that in the middle of a turn or a scroll is itself a visible hitch.
Decide what the light tier drops#
A light tier is a design decision, not just a lower pixel ratio. In Gem Forge it means:
- pixel ratio 1 instead of the device ratio (on a 3x phone that alone is up to nine times fewer pixels to fill);
- a particle cap of 90 instead of the full one, and a third of the particles per match;
- no glow sprites, no score popups, no ambient twinkles.
The rule I used: drop what decorates, keep what tells the player something. The burst when gems match stays, just smaller, because it confirms the move. The idle twinkle on the board is pure decoration, so it goes first. If the light tier removed feedback, players on slow phones would get a worse game, not just a plainer one.
Stop allocating inside the frame#
Garbage collection pauses are the most common reason a game that averages 60 fps still feels choppy. In a frame loop, every new Vector3(), every { x, y } literal, every array.map creates something the collector has to clean up later, and it does that at a moment you did not choose.
What I changed in Greek Sail:
- Scratch vectors and matrices are created once at module level and reused every frame.
- The host size comes from a
ResizeObserverand is cached. The frame never readsclientWidthorgetBoundingClientRect, because reading layout inside the loop can force the browser to recalculate styles right there. - Work that has nothing to do (the boat is at rest, nobody is touching the screen) is skipped, and idle frames in the slow intro view run at about 30 fps.
In Gem Forge the particle list was trimmed with splice, which shifts every element after the removed one. With a few hundred particles that is a lot of copying per frame for no reason. Particle order does not matter, so a swap-remove is enough:
// Order does not matter, so overwrite with the last item and pop.
this.particles[i] = this.particles[this.particles.length - 1]!;
this.particles.pop();
Sprites themselves come from a pool and go back into it instead of being destroyed and created again.
Draw expensive things once#
Windfall is a painted landscape made of several canvas layers: sky, hills, grass, trees. My first version blurred grass and canopy strokes one by one with ctx.filter = "blur(...)", every frame. Canvas blur is expensive, and calling it per stroke multiplied the cost by the number of strokes.
The fix was to bake: paint each static layer once to an offscreen canvas, blur the whole foreground layer once on a scratch canvas, and then only copy finished bitmaps in the frame. Moving parts (wind, light) are drawn on top. A layer that does not change between frames should never be painted again.
Keep every canvas on one raster path#
This one took a while to find. Windfall ran fine on my machine and at about 1 fps in the headless test browser, so the end-to-end tests timed out.
The test browser has no GPU and uses a software renderer (SwiftShader; on Linux VMs it is often llvmpipe). Some of my offscreen canvases ended up GPU-backed and others CPU-backed, so every frame the browser copied pixels between the two worlds. On real GPUs that copy is cheap enough to hide. On a software renderer it ate the whole frame.
Once every canvas used the same path on software GL, the same scene went from about 1 fps to around 18 fps in that browser. Real visitors also hit this: GPU-less office VMs, remote desktops and some Chromebooks with the GPU blocklisted run exactly this software path.
You can detect it:
const dbg = gl.getExtension("WEBGL_debug_renderer_info");
const gpu = dbg ? String(gl.getParameter(dbg.UNMASKED_RENDERER_WEBGL)) : "";
const software = /swiftshader|llvmpipe|software/i.test(gpu);
For a game I use this to start straight in the light tier. For a decorative scene (my home page hero) I skip WebGL completely there and leave the HTML version, because a raymarching shader on the CPU freezes the whole page.
Show an fps counter while you build#
Every game in my Lab has an fps readout in development, and Greek Sail also prints the current step (48 fps · step 1). Without it you only notice the watchdog when something already looks wrong. With it you see when a tier changed and can check whether it changed for a good reason.
Test on the slowest thing you have, not on your work laptop. Chrome DevTools CPU throttling (4x or 6x) gets you close for main-thread work; for GPU work there is no substitute for a real cheap phone.